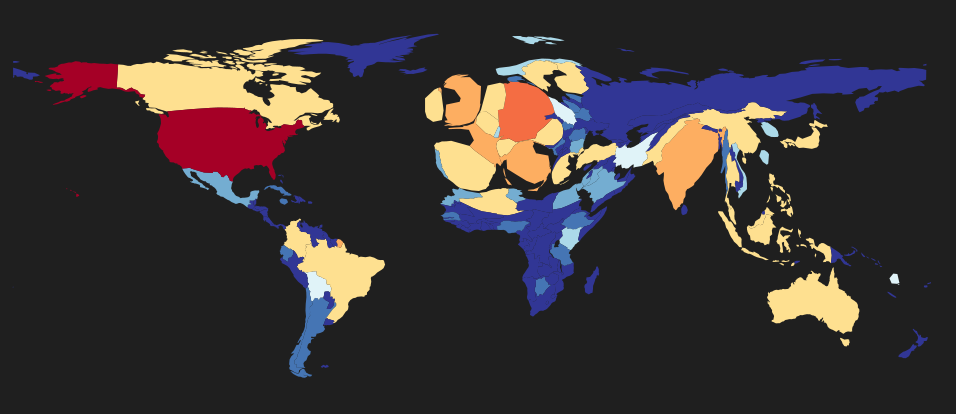
A Cartogram of Unique Visitors to the SWJ Page over one Week
This cartogram shows the unique visitors to the SWJ page over about one week proportional to the size of the country of origin. Check out Germany, the Netherlands, or Italy as examples. The cartogram was generated using D3, topoJSON, and cartogram.js using our piwik data. Right now, we are working on an interactive version for our new portal.
- Krzysztof Janowicz's blog
- Log in or register to post comments
- 10549 reads